Personal weblog of Ted Pavlic. Includes lots of MATLAB and LaTeX (computer typesetting) tips along with commentary on all things engineering and some things not. An endless effort to keep it on the simplex.
“Voting should take some effort. It means more that way.”
This was a statement I copied from a social media post of an old acquaintance, but I have heard the same sentiment from many others. They say that voting is important, perhaps the most important assertion of someones feelings that they can make, and so a certain amount of inconvenience is necessary to adequately motivate someone to deliberate on important options and make an informed choice. This logic usually then takes a leap and leads to the conclusion that all voting should be in person; mail-in voting is “too easy” to encourage people to make good choices.
However, the danger of using in-person voting as an explicit barrier to entry to filter out those who do not “care enough” about voting is that the burden of in-person voting is not the same across an entire population. Thus, accepting in-person voting as the mechanism that imposes costs (and requires effort) is an implicit statement that some votes are less valuable than others not because the voter cares less but because the voter happens to be more burdened by the process of in-person voting. But voting is meant to be a vehicle for those who will be affected by government actions to have a voice in deciding who will make up the government that takes those actions. Those who are the most burdened by lack of infrastructure, for example, should certainly not be attenuated; if anything, their voices should be amplified.
Furthermore, it is false to suggest that voting by mail is far easier than voting in person. Voting by mail requires considerable deliberation, care, and effort to complete. Just because someone receives a ballot in the mail (which they may have had to go through a process to register to receive) does not mean that they will open it, complete it (perhaps bubbling in tens to hundreds of bubbles), package it properly to return, and deposit to a mailbox. You could argue that if someone lives next to a polling location, it would be much easier to wander in and vote electronically with little deliberation (just tapping randomly on a screen) than it would be to actually fill out and return a mail-in ballot properly. In fact, if we were to abolish in-person voting entirely so that everyone would have to vote by mail, my guess is that many voters who found in-person voting very convenient might start skipping some elections because they couldn’t be bothered with the longer process of mail-in voting.
And that’s the big point — asymmetries of convenience create biased voting demographics. The issue is not that voting by mail is “so convenient” (because it isn’t!); it is that voting in person is, for some, prohibitively inconvenient. There should be a space for both kinds of voting (and possibly more). If we really want a representative sample of a population, we have to ensure our sampling methods do not inadvertently (or otherwise) exclude parts of the population that will be affected by the outcome of the process of voting that they were excluded from.
If you really do want voting to “take some effort”, it should be motivational effort that is equally applicable to everyone and not physical effort that varies from person to person or community to community. Where do we get that motivational-effort barrier? From very large numbers of people voting. If large numbers of people vote, then each person feels that their vote is inconsequential, and so the costs of voting will always be larger than the benefits. This surplus in the costs of voting will always present a motivational barrier, and the size of that barrier will be similar across the large population of voters. Thus, magnifying the costs of voting is best accomplished by magnifying the number of people voting; it is poorly accomplished by magnifying the physical distance between some voters and their voting location.
An epidemic is not a single number. Knowing exactly how bad an epidemic is requires knowing both how quickly it is going to spread and how bad its effects will be on those who are affected by it. To make matters worse, parameters that characterize each of these separate factors usually cannot simply be “multiplied together” to understand their composed effects. They have to be filtered through dynamical models that properly account for depletion and saturation effects in populations. So it is understandable that the average person might have a hard time making sense of CDC estimates of such parameters, and it is not surprising that there are a lot of misconceptions and misperceptions about these topics.
Let’s take the CDC COVID-19 Pandemic Planning Scenario report (as of May 20, 2020). This looks like a simple document at first, but it may be difficult to understand how to pull all of these numbers together. For a variety of reasons, parameters of interest to epidemiologists are difficult to estimate from data. One method to mitigate issues with incomplete or noisy data is to make assumptions that help fill in the gaps, but then your analysis is only as good as your assumptions. To be conservative and to understand how sensitive predictions are to these assumptions, the CDC has come up with five different “scenarios” that stretch across a wide range of assumptions. To keep things simple, we will focus on “Scenario 5: Current Best Estimate”, which is the CDC’s best guess at where these epidemiological parameters are.
It is best to start with everyone’s favorite epidemiological parameter, R0. This is the so-called “basic reproduction number.” It is a measure of how fast a contagious infection can spread. R0 is the combination of three factors:
The rate of interaction between an infectious (contagious) person and others in the population (referred to as “contact rate” below in some places)
The probability that an infectious person will infect someone that they come in contact with
How long an infectious person stays infectious (we assume that after this period, they are in a permanent recovered state where they are immune to further infection)
Essentially, R0 is a ratio of the rate that an infectious person infects others to the rate that an infectious person becomes well. This ratio can be interpreted as the number of people an infectious person infects before they themselves stop being infectious. If R0 is less than 1, then a disease will naturally die out because (on average) those infected will not be able to infect someone else before they become well. If R0 is greater than 1, then we have a so-called endemic. That means that the infectious disease will be constantly maintained at some background level; some fraction of the population will always be either currently infectious or recovered. Interestingly, this fraction is not 100%. As an infectious disease spreads through a population, the number of those who are susceptible to further infection declines to a point where it is rare for infectious individuals to encounter them (contacts with infected and recovered are far more common). This means that when susceptible individuals are rare, each infectious individual spreads less of the infection during the time window that they are infectious. This is the so-called herd immunity. A fraction of the population can stably remain susceptible because they are protected by the large numbers of others who have already had the disease and buffer them against contact with those who are currently infectious. The fraction of the population that will remain susceptible at the so-called endemic equilibrium is 1/R0. Likewise, the fraction of those in a population that must have been infected (or vaccinated, if possible) in order to achieve herd immunity is (1–1/R0). I should note that this simplified model assumes that infectious people eventually become recovered and stay that way; things get more complicated if immunity is not long lasting.
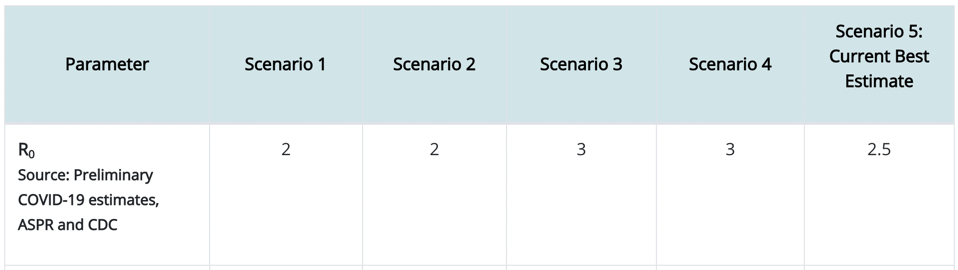
So what does the endemic equilibrium (“herd immunity”) look like for COVID-19 (assuming long-lasting immunity)? Here is what CDC estimates for R0.
Again, focusing only on Scenario 5, we take R0=2.5, which means that any infectious person will have an opportunity to infect 2.5 other people on average. So we then estimate that 1/R0=1/2.5=40% of the population will be able to avoid infection so long as the other 60% of the population goes through an infection or is vaccinated. So exactly how many people is that? In the United States, the population is a little over 325 million people (compare this to the world population of 7.8 billion people). So that means that 60% of the 325M people in the USA must be infected to achieve herd immunity. That’s 195M people in the USA (4.68 billion people worldwide).
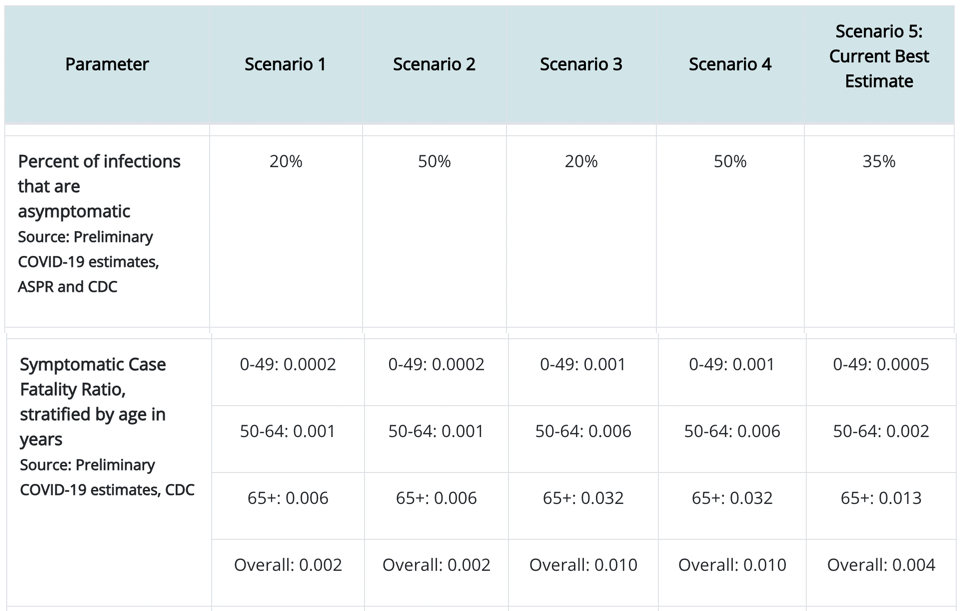
But not everyone who is infected sees symptoms let alone has to go to a hospital or suffers an early death. If we go back to the CDC data, we see that…
CDC estimates for asymptotic ratio and symptomatic case fatality ratio for COVID-19
Again, looking at Scenario 5, we see that 35% of those who have an infection show no symptoms. We also see that those other 65% who show symptoms will suffer fatality at an overall (averaged across age groups) rate of 0.004 (i.e., 0.4%). That seems like a very small number! But we have to keep in mind that this is a very contagious disease (any infectious person infects 2.5 other people). So we need to combine the information on contagion with the information on case fatality rate. For the 325M people in the USA, we already calculated that 195M will have the disease. So then, at the endemic equilibrium (“herd immunity”):
195M*65% = 127M people will have shown symptoms in the USA
127M*0.4% = 508,000 people will die in the USA
And worldwide, we would expect 12.2M people will die. So even at that very small case fatality rate, there will be a lot of death (and even those that escape symptoms may still feel long-term effects of COVID-19 that we are only starting to understand now). Just as a reference, 38,000 people died in car accidents in 2018 in the USA. We try to prevent deaths by car accidents by preventing car accidents and trying to make cars safe so that people will survive accidents that happen. When we ask people to wear masks and social distance, this is not unlike people’s legal obligation to wear seatbelts and drive cars that meet safety standards.
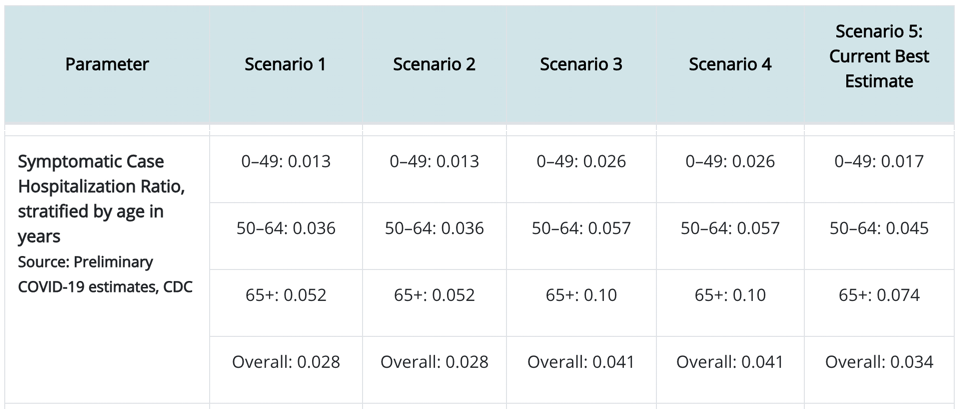
Now, a lot of people say that there is no way to prevent these deaths, and so it is better to suffer them early instead of dragging out our march to the endemic equilibrium. In order to evaluate whether this is a good argument, we should take a look at another part of the CDC data:
CDC estimates for symptomatic case hospitalization ratio for COVID-19
Focusing on Scenario 5’s “Overall” estimate, we see that each person who shows symptoms will have a 3.4% chance of being hospitalized. So that means we can estimate that for the population of 325M people in the USA, the 127M people we calculated above to show symptoms, 3.4% of them will have to be hospitalized, meaning that COVID-19 contribute 4.318M patients to hospitals in the USA (103M COVID-19 hospital patients worldwide). The question is whether we have enough hospital beds in the USA to accommodate these 4.318M people all at once. If we do not, then those that would have otherwise recovered will have to suffer through the disease without the support of medical professionals and medical technology. In other words, the case fatality rate for this subset of COVID-19 symptomatic individuals turned away from hospitals may rise to much higher than the 0.4% mentioned above. So this is really the essence of the movement to flatten the curve(e.g., by wearing masks and social distancing to reduce the effective contact rate). Even if it is impossible to avoid the 508,000 deaths predicted above, if infections can be spread out over a long amount of time, we can help to ensure that at any instant there will be enough hospital beds. Furthermore, if we stretch out the infection curve far enough, we may develop a vaccine within the curve’s duration. Vaccinations are a game changer because they provide a quick shortcut (that is hopefully much safer than a full-blown infection) to herd immunity.
But if we wanted to reduce that 508,000 without a vaccine, how would we do it? Remember that I said that R0 (a parameter of infection spread) is determined in part by the rate that an infectious individual contacts other individuals in the population. If we can devise long-term behavioral or technological methods to reduce this contact rate (beyond temporary inconveniences, such as wearing masks), then we can change R0 for COVID-19 for good (or at least for a sufficiently long time), thereby meaning that our endemic equilibrium (“herd immunity”) will occur with a much higher number of people who avoid infection (and even vaccination) entirely. How do we do that? Here are three potentially powerful ways.
We can remove hand shaking and other similar kinds of contact as a greeting (thereby bringing the baseline contact rate for every individual in the population to a much lower level than it was before COVID-19).
We can develop rapid, highly available, and frequent testing protocols that can quickly identify infected individuals so that they can be isolated (thereby bringing their personal contact rate much lower than others).
We can develop sophisticated contact-tracing techniques that can further identify potentially infected individuals so that they can be isolated (thereby bringing their personal contact rate much lower than others).
These behavioral and technological changes can actually improve our long-term COVID-19 outcome even if a vaccine is not developed. So it may not be inevitable that hundreds of thousands of more people have to die (at the time of this writing, over 110,000 people in the USA had death certificates that indicated COVID-19 as a cause of death).
Medical professionals can develop vaccines, researchers can develop novel technologies, and we can all alter our behaviors. Unfortunately, there are additional challenges in the near future that will make all of this even more urgent. In particular, we are facing a flu season ahead of us. Individuals who contract COVID-19 and the seasonal flu simultaneously may be in an untenable situation. Additionally, the medical system will face demands not only from COVID-19 but from those with the flu (but possibly not COVID-19) who also need hospitalization. Normally the medical system would have enough capacity to serve the seasonal flu population (although there are still seasonal flu deaths every year, just not as much as COVID-19). However, if the medical system has to face flu and COVID-19 along with baseline demands and any other emergent demands (other pandemics, etc.), then that will put our society as a whole in an untenable situation. The flu shot may be especially important to encourage this season.
Of course, there are many other interesting figures in that CDC report that we could further analyze that relate to how long the average COVID-19 hospital patient takes to recover, which would help us figure out more quantitative details about the amount of each of the kinds of possible actions discussed above will be necessary to prevent hospitals reaching capacity. For now, I will leave that analysis as an exercise for the reader. In the meanwhile, get some rest, stay safe, and stay healthy!