[ In a Google+ post, someone asked whether symbiosis was a good example of group selection. I responded in a comment, and another comment asked me to expand my response a little bit in my own post. So here is a copy of that post (with a few more hyperlinks). ]
Part 1: What is group selection?
Typically "group selection" doesn't cross species boundaries. That is, group selection refers to the proliferation of a particular form of a gene, otherwise known as an "allele", due to its benefits to groups of individuals which share that allele despite the individual costs of having that allele. It may help to consider the basic group-selection argument for the evolution of altruism (i.e., the evolution of behaviors that are costly to an individual and yet beneficial to a different unrelated individual). Before that, consider why we wouldn't expect altruistic alleles to have strong representation in a population.
For every gene or group of genes, there can be many different variations (alleles). Some of those variations will be deleterious to an individual, and so you would expect the relative representation of those deleterious variations to decrease over generations. So imagine if one of those alleles encoded an altruistic trait that caused an individual to do something costly for the benefit of another (e.g., helping a stranger understand group selection with no expectation of future payoff). Individuals with that allele are suckers. Those without that allele instead focus on tasks that return direct benefit to themselves, and that direct benefit would payoff with greater productivity of offspring that share that non-altruistic allele. When an altruist met a non-altruist, the benefit from the altruist would increase the non-altruist's alleles representation in the next population while decreasing its own alleles' representations. So we would expect that altruistic alleles would fade away into obscurity. Moreover, the benefit from all of the altruists would diffuse across the variety of alleles rather than being concentrated on just the altruistic ones.
However, what if that altruistic allele also encoded a behavior that would seek out others with that same allele. This non-random association means that each individual who helps another does actually help to increase the productivity in that allele. That is, even though there is a cost to the individual doing the altruistic task, the benefit going to the other individual is felt by the other copy of the same allele in the different (and unrelated) person. So when these altruists group together, altruistic benefits do not diffuse. They are captured within the group. Moreover, the group's synergy can cause it to be more productive than the remaining groups of non-altruists. Consequently, the altruistic allele not only persists in the population, but its representation can grow because there is a differential benefit between altruistic and non-altruistic groups. It is this differential benefit between groups that is group selection.
Part 2: Symbiosis and Mutualism
A symbiotic relationship between members of different species is not group selection (in general) because it does not posit that there is a mutual allele that may be deleterious in an individual but beneficial in a group. That is, there is no group synergy that is mitigating individual costs by generating benefits elsewhere that help to support alleles that would otherwise naturally decay. When species are mixed within a population of interest, the analysis is a bit different because alleles cannot flow across the species barrier (except for special cases).
For example, consider an allele that existed across species (e.g., an allele for a gene shared between humans and bonobos), the speciation in general would prevent the sort of group selection gains because there would be no way for increased numbers of alleles in one species to transfer to the other species. Imagine that altruists in one species seek out altruists in the other species. The result could lead to more increases in the altruist representation in one species than another, and so there would be an altruist surplus. Those surplus altruists would have no choice but to associate with non-altruists in the other species. However, if the group was all of one species, then there would not be surplus altruists. Altruistic benefit need not diffuse across non-altruists too.
However, most examples of symbiosis are not altruistic. Instead, they are mutualistic. That is, the behavior does benefit another, but that is a possibly unavoidable side effect of an action that benefits the individual doing the behavior. For example, if I'm driving through a parking lot looking for an empty space to park, I am revealing information to my competitors (other drivers) about where empty spots are not. I don't want to help the competing drivers, but it is unavoidable because they can see me go down an isle of the parking lot and not find a spot. Consequently, they do not go down that same isle. Of course, I use their searching behavior to inform my choices of the next isle. So we are doing "cooperative search" only because the behaviors have mutual benefits. The same goes for many symbiotic relationships among individuals of different species.
Consider a remora ("sharksucker"). It's a small fish that essentially attaches to another host (fish, whale, turtle, etc.). It can receive nutrients from on or around the host. It can also be protected from predators that avoid the host. In some cases, the host could eat the remora, but the remora is so small that it may not be worth the effort. Some hosts actually receive a small benefit (cleaning, for example) from the remora. Regardless, the remora experiences very little cost and plenty of benefit. Moreover, the host experiences very little cost and possibly some benefit. So there's no surprise that this behavior evolved. You don't need any fancy mathematical model to show how this is possible – when the benefits align like this, it's natural to assume that it is going to be favored by natural selection.
Part 2.5: Symbiosis and Co-evolution
Having said all of that, symbiosis can lead to elegant examples (or at least suggestions) of co-evolution, which describes how a change in one species can lead to a change in other species. In particular, natural selection on different species creates a feedback across species. One species is the ecological background for another species, and so as each species changes it creates new niches (and destroys old ones) for other species. So the evolution of one species can guide the evolution in another. But I think this post is long enough. :)
More information
Wikipedia does a pretty good job on these particular subjects. Check 'em out there.
( I have also mirrored this content on a post on my website. )
Showing posts with label biology. Show all posts
Showing posts with label biology. Show all posts
Wednesday, September 28, 2011

Friday, May 06, 2011
Someone asked me to explain the Price equation today...
I got an e-mail today asking for help understanding the Price equation, prompted partly by the recent RadioLab about George Price. The person who e-mailed me made it sound like he was OK with a long explanation, just so long as it explained the ugliness of the mathematics. Here is my response... (pardon the e-mail-esque formatting... I'm just pasting it rather than re-formatting it)
[ This post can also be found on my web page. ]
[ This post can also be found on my web page. ]
You shouldn't believe everything the media tells you about the complexity of the Price equation. I'm always frustrated when I hear someone on the radio read the Price equation out loud as a mathematical statement. It is not meant to be a mathematical statement. It is just a logical justification for something we all think should be true -- traits with higher differential fitness advantage should spread throughout a population (which is a critical aspect of natural selection). Price formalized that statement and then proved that the formalism is a tautology. That's all that's important.
It is a very simple idea, and it has almost nothing to do with statistics (because there are no random variables nor data in the price equation). The Price equation is a theoretical statement about the relationship between two sequential generations of a model population. You can use it to predict how the representation of a particular trait will change over time and eventually settle at some fixed distribution. However, again, numerical applications aside, it really is just a mathematical verification of something which makes intuitive sense.
Just to get comfortable with the notation, consider a trait like "height" across a population of n=100 individuals. Each individual might have a different height. Let's say that in our population, people basically have two different heights (perhaps due to sexual dimorphism). So we have two groups:
z_1 = 5 feet
z_2 = 6 feet
We represent the number of people with each height using the variables:
n_1 = 50
n_2 = 50
That is, there are an equal number of 5' tall people and 6' tall people from our 100 person population (note that n_1 + n_2 = n). Further, we find that both 5' tall and 6' tall people tend to have 1 offspring each. That is, they both have an equivalent "fitness" of 1:
w_1 = 1
w_2 = 1
Where w_i is the number of offspring an individual of group i will contribute to the next generation. Let's say we also know that offspring from 5' tall people end up also being 5' tall, and offspring of 6' tall people also end up being 6' tall. Then we have:
z'_1 = 5 feet
z'_2 = 6 feet
So the value of the trait (height) does not change from generation to generation.
Everything above is a parameter of the model. It represents what we know about "height" of individuals in this generation as well as the relationship between the height of an INDIVIDUAL and its offspring. What Price equation does is tell us about how the distribution of height in the POPULATION will change from this generation to the next. It might be helpful to think about Price equation as relating the AVERAGE value of a trait (e.g., height) in one generation to the AVERAGE value of the trait (e.g., height) in the next generation.
So now let's add-on the Price equation stuff. To account for the changes in the average value of the trait (height here), we have to worry about two effects -- "background bias [due to individuals]" (my term) and "differential fitness" (a quantity that drives natural selection):
1.) Imagine that 5' tall parents produced 5' tall offspring (so z'_1=z_1=5 feet, as above), but 6' tall parents produced 10' tall offspring (so z'_2=10 feet in this hypothetical scenario). Then even without worrying about "differential fitness", we might expect an upward shift in AVERAGE height from the parent generation to the offspring generation. This "background bias [due to individuals]" is related to the "E(w_i \delta z_i)" term in the Price equation. It represents the change in a trait at the individual level. I'll give more info about the math later.
2.) Now, instead, assume that z'_1=z_1 and z'_2=z_2 (so offspring height is the same as parent height) as above. It may still be the case that the average height in the offspring generation changes from the parent generation. This would occur if one height had a higher fitness than the other height. Here, we see that w_1=w_2=1. They both have the same fitness, and so we don't expect any differences IN REPRESENTATION from one generation to the other. Note that if w_1=w_2=5, then each individual would produce 5 offspring. Consequently, the TOTAL population would grow, but the DISTRIBUTION of height would stay the same. To make things more interesting, imagine that w_1=1 and w_2=2. Now each 5' tall person produces one 5' tall offspring, but a 6' tall person produces TWO 6' tall offspring. Consequently, the distribution of height would change from parent to offspring generation. The AVERAGE height would shift toward 6' tall people. The "cov(w_i, z_i)" term aggregates this change. It relates the "differential fitness" of one height to its success into growing the representation of that height in the next generation. I'll give more info about the math in a bit. [NOTE that the average fitness represents the average "background" rate of growth from population to population.]
To get ready for an explanation of the actual Price equation, let's get some terminology out of the way.
First, we define the "expectation" or "average" height in the current population with:
E(z_i) = ( n_1 * z_1 + n_2 * z_2 + ... )/n
That is, "E(z_i)" is the average value of the trait (height above). There are n_1 individuals with z_1 value of the trait, and so we have to multiply n_1 * z_1 to get the total contribution of that value of the trait. We do that for each group. We can do the same for other variables too. For example, here's average fitness:
E(w_i) = ( n_1 * w_1 + n_2 * w_2 + ... )/n
The average fitness "E(w_i)" somehow represents the average rate of population growth. If every w_i is 1, then there will be 1-to-1 replacement of parent by offspring and there will be no population growth; likewise, the average "E(w_i)" will be 1 reflecting no growth. However, if every w_i is 5, then "E(w_i)" will also be 5 and the population will grow 5 fold every generation. With some simple arithmetic, it is easy to verify that the total population in the NEXT (i.e., offspring) generation is given by the product of the number of individuals in this generation (n) and the average fitness (E(w_i)).
We can also find the average value of the trait in the NEXT (i.e., offspring) generation. To do so, we have to scale each value of the trait in the next generation (z'_i) by the number of individuals with that trait in the next generation (n_i w_i), and then we have to divide by the total number of individuals in the next generation (n*E(w_i)). So the average value of the trait in the NEXT (i.e., offspring) generation is:
E(z'_i) = ( n_1 * w_1 * z'_1 + n_2 * w_2 * z'_2 + ... )/(n * E(w_i))
For simplicity, let's use symbols "z", "w", and "z'" as a shorthand for those three quantities above. That is:
z = E(z_i)
w = E(w_i)
z' = E(z'_i)
Penultimately, let's define "delta" which gives the difference in a variable from the this generation to the next. The difference in the average value of the trait is:
delta(z) = E(z') - E(z)
that difference may be due either to differential fitness (i.e., when w_i is not the same as w) or to intrinsic height changes at the individual level. Those intrinsic height changes at the individual level are:
delta(z_1) = z'_1 - z_1
delta(z_2) = z'_2 - z_2
...
Finally, let's define this "covariance" formula. For each group i, let's say we have variables A_i and B_i (e.g., z_i and w_i). Let A be the average value of A_i across the population:
A = ( n_1 A_1 + n_2 A_2 + ... )/n
and B be the similarly defined average value of B_i across the population. Then we can define the covariance across the POPULATION in a similar way as we defined average. That is:
cov( A_i, B_i )
=
E( (A_i-A)*(B_i-B) )
=
( n_1*(A_i - A)*(B_i - B) + n_2*(A_2 - A)*(B_2 - B) + ... )/n
That is, cov(A_i,B_i) is the AVERAGE value of the product of the difference between each A_i and its average A and the difference between each B_i and its average B. We call this the "covariance" because:
* If A_i doesn't vary across values of i, then A_i=A (no "variance" in A) so there is no "covariance"
* If B_i doesn't vary, then there is similarly no covariance
* If whenever A_i is far from its average B_i is close to its average, then there is LOW (i.e., near zero) covariance. That is, both A_i and B_i vary across the population, but they don't vary in the same way.
* If whenever A_i is far from its average B_i is also far from its average, then there is HIGH (i.e., far from zero) covariance. Both A_i and B_i vary across the population, and they vary in the same way.
Note that HIGH covariance could be very positive or very negative. In the positive case, A_i and B_i have a similar pattern across values of i. In the negative case, A_i and B_i have mirrored patterns across values of i (i.e., A_i is very positive when B_i is very negative and vice versa). LOW covariance is specifically when the cov() formula is near zero. That indicates that the pattern of A_i has little relationship to the pattern of B_i.
Now, let's look at the Price equation more closely. The left-hand side:
w*delta(z)
is roughly the amount of new trait ADDED to each "average" individual. So if the average trait shifts (e.g., from 5.5' tall to 6.5' tall, corresponding to a delta(z) of 1'), but the population has GROWN as well (i.e., "w>1"), then amount of height "added" to the parent population to get the offspring population is more than just 1' per person. We scale the 1' per person by the "w" growth rate. Thus, "w delta(z)" captures effects of population growth (which naturally adds trait to a population) and mean change in representation. Note that if the AVERAGE trait did not change ("delta(z)=0") but the population did grow ("w>1"), then we interpret "w delta(z)=0" to mean that even though the "total amount" of trait increased due to population increase, there was no marginal change in each individual's trait (i.e., individuals aren't getting taller; the population is just getting larger).
Now let's look at the right-hand side:
cov(w_i, z_i) + E(w_i*delta(z_i))
This implies that the amount of new trait added to each average individual is the combination of two components.
To parallel the discussion above, let's consider the E() part first:
E(w_i * delta(z_i))
we can expand this average to be:
( n_1*w_1*(z'_1 - z_1) + n_2*w_2*(z'_2 - z_2) + ... )/n
That is, delta(z_i) gives us the average change from AN INDIVIDUAL to A SINGLE OFFSPRING from z_i to z_i'. The w_i part ACCUMULATES those changes to EACH offspring. For example, if w_1=2, then group 1 parents have 2 offspring. So the total increase in the trait from group 1 is not delta(z_1) but is 2*delta(z_1). So you can see how this is the "BACKGROUND BIAS" representing the "w*delta(z)" component that we get even without worrying about differential fitness. This represents the change in "w*delta(z)" just due to INDIVIDUALS and POPULATION GROWTH.
Next, look at the covariance:
cov(w_i, z_i)
The covariance of w_i and z_i is a measure of how much the DIFFERENTIAL FITNESS contributes to added trait. Recall the formula for cov(w_i,z_i):
E( (w_i-w)*(z_i-z) )
which is equivalent to:
( n_1*(w_1-w)*(z_1-z) + n_2*(w_2-w)*(z_2-z) + ... )/n
Here, the quantity (w_i-w) is the "differential fitness" of group i, and the quantity (z_i-z) represents the location of the trait with respect to the average trait. So:
* if the fitness varies in a similar way as the level of trait across values of i, then the average value of the trait will tend to increase from population to population
* if the fitness varies in exactly the opposite way as the level of the trait across values of i, then the average value of the trait will tend to decrease from population to population
* if the fitness varies differently than the level of the trait, then there will be little change in the average trait from population to population
* if there is no variance in either fitness nor level of the trait, there will be little change in the average trait
Put in other words:
* if high differential fitness always comes with high values of the trait and low differential fitness always comes with low values of the trait, then there will be selection toward MORE trait
* if high differential fitness always comes with to low values of the trait and low differential fitness always comes with high values of the trait, then there will be selection toward LESS trait
* if differential fitness variation has no relationship to trait level variation, then selection will not change the average value of the trait
* if there is no variation in the trait or no variation in the fitness, then selection will not change the average value of the trait
Put in MORE words at a more individual group level:
If a group i has both a high "differential fitness" (w_i-w) AND a high (z_i-z), then its FITNESS w_i is far above the average fitness w and its level of the trait z_i is far above the average value of the trait z. Either one of those alone would be enough to cause the "total amount" of trait to shift upward. On the other hand, if BOTH (w_i-w) and (z_i-z) are NEGATIVE, then the average population is already far away from this trait value AND has a much higher fitness. Consequently, the motion of the average trait will still be upward, but here upward is AWAY from the trait z_i (because z_i is under the average z). Finally, if (w_i-w) and (z_i-z) have opposite signs, the motion of the average trait z will be negative, which will either be heading toward z_i if w_i>w or away from z_i if w_i<w. The covariance formula takes the average value of (w_i-w)(z_i-z). That average represents the contribution to the amount of trait "added" to each individual due to DIFFERENTIAL FITNESS.
So there you have it. Assuming that "w" (average fitness -- which is a growth rate) is not zero (which just assumes that the population does not die out in one generation), then we can divide everything by "w" to get a less complicated (but equivalent) Price equation:
delta(z) = ( cov(w_i,z_i) + E(w_i*delta(z_i)) )/w
So now we have an equation representing the average change from parent to offspring population. If you expand all the formulas, you can verify that this statement is equivalent to:
delta(z) = cov(w_i/w, z_i) + E( (w_i/w)*delta(z_i) )
The quotient "w_i/w" is a "fractional fitness." It is a measure comparing the fitness of group i with the average fitness, where high differential fitness corresponds to w_i/w > 1 and low differential fitness corresponds to w_i/w < 1. So let's create a new variable
v_i = w_i/w
to be the fractional fitness. Then we can rewrite Price's equation to be:
delta(z) = cov( v_i, z_i ) + E( v_i*delta(z_i) )
This version gets rid of the need to worry about scaling for population growth. If you think about it, v_i is just a normalized version of w_i where you have "factored out" the background growth rate of the population. So now we basically have:
AVERAGE_CHANGE
=
POPULATION_CHANGE_DUE_TO_DIFFERENTIAL_FITNESS
+
POPULATION_CHANGE_DUE_TO_INDIVIDUAL_CHANGES
In other words:
"the change in the average value of the trait is due to two parts:
1. The differential fitness of each value represented in the population
2. The individual change from parent trait level to offspring trait level"
So if you wish to go back to the "height" example...
"The average height increases when:
1. Natural selection favors increases in height
OR
2. Tall people have taller offspring"
You could create other variations that work as well:
"The average height DEcreases when:
1. Natural selection favors DEcreases in height
OR
2. Short people have shorter offspring"
====
"The average height stays the same when:
1. Natural selection has no preference for height
AND
2. Short people have short offspring and tall people have tall offspring"
====
"The average height DEcreases when:
1. Natural selection has no preference for height
AND
2. Short people have short offspring and tall people have short offspring"
====
"The average height INcreases when:
1. Natural selection has no preference for height
AND
2. Short people have tall offspring and tall people have tall offspring"

Wednesday, September 08, 2010
Red Queen Hypothesis 2.0: Social Networking (and the Internet) as a response to disease
After hearing someone in the next cubicle start hacking away, I got thinking about how the probability of me staying healthy is so greatly decreased by working in this common environment. That made me start dreading the arrival of new undergraduate and graduate students who might further pollute the air with their... um... filth.
The recent bedbug scare spreading across the nation (where Ohio is one hotspot) fits into this line of thinking too. One unlucky or unsanitary person turns into a possibly unaware transmission vector. Even those who are aware of the problem may be unwilling or unable to stop the problem. Of course, this goes for other pests like fleas as well. Moreover, as more people come back to the workplace, there is more chance of these pests moving from person to person, perhaps with a chair or a floor or a cubicle wall in between. It is the dual to herd immunity; it's herd vulnerability – a large group of healthy people are only as strong as their sickest link.
Driving to work today, I heard someone on NPR talk about how about the Internet is making offices unnecessary or deprecated. People are able to do work at home while still staying in contact with their customers and the rest of the work force. That is, they are still able to leverage the power of humans to form productive groups without having to actually be in the same space of those humans. With this still ringing in my ears coupled with the new sound of the guy in the next cubicle hacking away, it made me think that maybe the Internet and social networking are just another product of the Red Queen running to stay in one place. That is, although the ostensible purpose of physical isolation alongside virtual collaboration has nothing to do with disease, a collateral effect is that many communicable diseases have a hard time commuting across wires and fibers. So that's a happy thought, right?
On the other hand, there's that Bruce Willis movie that seems to be show the dystopia of my fantasy disesae-free future...
As if on cue, that thought is interrupted by a sneeze from the next cubicle over.

Monday, October 06, 2008
Officemate's bee research on NPR
The graduate school research of my officemate (Kevin Schultz) was featured on NPR All Things Considered on Saturday during the "Science out of the Box" segment:
"Bees Follow Their Leaders"
Professor Passino is our shared adviser, but my research has nothing to do with bee swarms. :) Professor Seeley is a collaborator of Passino/Schultz; he's from Cornell.
"Bees Follow Their Leaders"
When a swarm of bees takes flight, it can form a cloud as big as a school bus. But who's driving? And how do they know which way to go? Professor Thomas Seeley of Cornell University talks about how swarms of honeybees decide who's at the wheel and who's a backseat flier.The audio story is streamable from the NPR link.
Professor Passino is our shared adviser, but my research has nothing to do with bee swarms. :) Professor Seeley is a collaborator of Passino/Schultz; he's from Cornell.

Thursday, June 05, 2008
Pictures of Apple Snail ("Golden Mystery Snail") Laying Eggs
We have two apple snails (sold as an "ivory mystery snail" and a "golden mystery snail") in our small 6 gallon Eclipse tank. Evidently, the golden snail is a female and the ivory snail is a male, and so they mate all the time. In most tanks, this isn't a problem because the amphibious apple snails have to leave the water to lay their eggs and they can't do that when the tank has a lid on it. However, the Eclipse tank has a large dome-shaped lid so that everything (pump, filter, etc.) can be built into it. So, our female has been crawling up into the lid and laying eggs.
This morning, I couldn't find the female in the bottom part of the tank, and so I lifted the lid... and there she was! I've never seen pictures of an apple snail LAYING eggs, so I thought I'd take some. Unfortunately, they came out kinda blurry, but at least it's something!
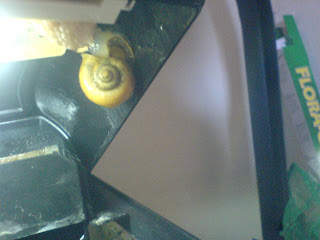 You can see the egg sac she's laying right next to her. You can see that as she moves backward, the egg sac gets longer.
In the first picture, on another part of the lid, are some of the remnants of an old egg sac that has hatched (before we realized she was leaving the tank to lay her eggs).
Anyone have any ideas about how to prevent the snails from leaving the water? (note: throwing away the tank is not an option) We'd move the snails to our big tank that has a flat lid, but we're pretty sure our freshwater puffer would slowly dine on the snails until they died a long slow death.
This morning, I couldn't find the female in the bottom part of the tank, and so I lifted the lid... and there she was! I've never seen pictures of an apple snail LAYING eggs, so I thought I'd take some. Unfortunately, they came out kinda blurry, but at least it's something!


In the first picture, on another part of the lid, are some of the remnants of an old egg sac that has hatched (before we realized she was leaving the tank to lay her eggs).
Anyone have any ideas about how to prevent the snails from leaving the water? (note: throwing away the tank is not an option) We'd move the snails to our big tank that has a flat lid, but we're pretty sure our freshwater puffer would slowly dine on the snails until they died a long slow death.

Saturday, July 07, 2007
Breathing is carbon neutral, asshole
It's not uncommon to hear people say things like, "Carbon neutral? What's that? Wouldn't you have to stop breathing? <huh huh> <huh huh>"
The carbon in the carbon dioxide that you exhale is a product of cellular respiration inside your cells. It comes from breaking down sugar (a carbohydrate). The process liberates the carbon from the sugar so that it can bond with the oxygen that you inhale to form carbon dioxide and water (e.g., urine or "pee"), and this releases energy since carbon would much rather be a part of carbon dioxide than sugar. This energy is what you use to go about your day and say statements like the above.
So where does the sugar come from? It what is produced in the photosynthesis that goes on in plants. Photosynthesis uses energy from the sun to reshuffle water and carbon dioxide into oxygen and sugar.
That's right. The carbon you exhale comes from sugar that could not have been made without pulling carbon out of the air.
So that's why breathing is carbon neutral.
This is also why combustion, which is related to cellular respiration, of pure biofuels (hydrocarbons) is POTENTIALLY carbon neutral (see notes about sustainable yeilds); the carbon in those fuels was originally pulled out of the air by a plant somewhere, and hopefully more plants will pull it out of the air after combustion. Of course, there are lots of other things involved in combustion (e.g., processing and transporation of biofuels as well as the consumption that goes on in the process of burning those fuels) that are not carbon neutral (and, again, there's that issue of burning so many plants that you don't have any left to take the carbon out of the air; again, see sustainable yield).
You should consider these things when you think about livestock as well. Breathing does not prevent something from being carbon neutral.
So what isn't carbon neutral? If you are releasing carbon that did not (recently) come from a plant source, you are probably not being carbon neutral. Burning fossil fuels is liberating carbon that has been buried for (hundreds of) millions of years. This is why the word fossil is used. This carbon would have stayed buried if it was not for human intervention. This causes a stability problem on the surface of the earth. The carbon cycle gets out of whack because that extra carbon does not go back to its source. In fact, the only way to get that carbon back to where it came from is to have a mass extinction and then millions of years of geological processes.
So that's the scoop on carbon neutrality.

Saturday, January 13, 2007
Turtle Flatulence Sets Off Fire Alarm
Flatulent Turtle Sets Off Fire Alarm
Unfortunately, there was no one else around to blame. A hungry turtle who munched on Brussels sprouts managed to create big enough bubbles with his flatulence that it actually set off the fire alarm at the Sea Life Center in Weymonth in the UK. The flatulence was strong enough to set off the sensors throughout the aquarium, according to Marine Biologist Sarah Leaney.
When Leany raced to the aquarium, she thought it odd to find the place relatively calm and quiet. According to the Daily Record, she says: "When I got there, all seemed fine. I looked at the tube containing the sensor and saw a turtle beneath it. As I watched, a few large bubbles emerged from beneath him and rose to the surface next to the tube."
"I realized what must have happened. We like to give all our animals a treat at Christmas and sprouts are a really healthy choice for sea turtles. But they do produce similar side-effects to those experienced by humans who eat too many sprouts."

Subscribe to:
Posts (Atom)